")


 (RJF)")


Boise State University
Scholar Works
Computer Science Graduate Projects and Theses Department of Computer Science
5-1-2013
An Exploratory System for Collaborative Decision
Making in Community Planning
Aaron Dale Wells
Boise State University
AN EXPLORATORY SYSTEM FOR COLLABORATIVE
DECISION-MAKING IN COMMUNITY PLANNING
by
Aaron Dale Wells
A project
submitted in partial ful llment
of the requirements for the degree of
Master of Science in Computer Science
Boise State University
May 2013
BOISE STATE UNIVERSITY GRADUATE COLLEGE
DEFENSE COMMITTEE AND FINAL READING APPROVALS
of the project submitted by
Aaron Dale Wells
Project Title: An Exploratory System for Collaborative Decision-Making in Community Planning
Date of Final Oral Examination: 07 May 2013
The following individuals read and discussed the project submitted by student Aaron Dale Wells, and they evaluated their presentation and response to questions during the final oral examination. They found that the student passed the final oral examination.
Amit Jain, Ph.D. Chair, Supervisory Committee
Alark Joshi, Ph.D. Member, Supervisory Committee
Susan Mason, Ph.D. Member, Supervisory Committee
The nal reading approval of the project was granted by Amit Jain, Ph.D., Chair, Supervisory Committee. The project was approved for the Graduate College by John R. Pelton, Ph.D., Dean of the Graduate College.
dedicated to my children; may their dreams grow wings
ACKNOWLEDGMENTS
The author wishes to express gratitude to CRI Advantage for providing me with the time and means to accomplish this work.
ABSTRACT
Community planning problems di er from those of science, technology, and mathematics as they are not solvable with logical-empiricism. Their solutions are in uenced by technology, politics, style, economics, as well as the personalities and experience of those individuals collaborating on the solution. Obtaining cooperation of the stakeholders to implement community planning solutions can be cumbersome or simply cause failure in the implementation of plans. Yet, if the stakeholders had a real handle on the cost and bene ts the literature suggests that cooperation can evolve.
In this project, we explore building a reliable cost and bene t model for a set of input parameters that may allow a collaborative solution to emerge more easily. Furthermore we hypothesize that in the decision process there is a tipping point between costs related to a decision and its bene ts. In order to test the hypotheses, we have designed and tested a software framework with focus groups that included locally elected o cials, economic development specialist, planners, and citizens. The software framework allowed the stakeholders to explore an interactive cost-bene t model, and researchers to collect those interactions and visualize them in real-time. The software framework developed for the study, its set up, and ndings based on a focus group study are discussed.
The software framework developed for this study and the included analysis tool provided were shown to be e effective in identifying the tipping-point moments in the group dynamics.
TABLE OF CONTENTS
ABSTRACT…………………………………………
LIST OF TABLES…………………………………….
LIST OF FIGURES……………………………………
LIST OF ABBREVIATIONS …………………………….
1 Introduction……………………………………….
1.1 Problem Overview . . . . . . . . . . . . . . . . . . . . . . . . . . . . . . . . . . . . . . . . .
1.2 Experimental Setup . . . . . . . . . . . . . . . . . . . . . . . . . . . . . . . . . . . . . . . .
2 Functional Requirements ……………………………..
2.1 General. . . . . . . . . . . . . . . . . . . . . . . . . . . . . . . . . . . . . . . . . . . . . . . . . .
2.2 Distribution . . . . . . . . . . . . . . . . . . . . . . . . . . . . . . . . . . . . . . . . . . . . . .
2.3 Scalability. . . . . . . . . . . . . . . . . . . . . . . . . . . . . . . . . . . . . . . . . . . . . . . .
2.4 Flexibility. . . . . . . . . . . . . . . . . . . . . . . . . . . . . . . . . . . . . . . . . . . . . . . .
2.5 Data Collection and Future Analysis . . . . . . . . . . . . . . . . . . . . . . . . . . .
3 Technical Specification ……………………………….
3.1 General. . . . . . . . . . . . . . . . . . . . . . . . . . . . . . . . . . . . . . . . . . . . . . . . . .
3.1.1 Out of Scope. . . . . . . . . . . . . . . . . . . . . . . . . . . . . . . . . . . . . . . .
3.2 Data Store Layer . . . . . . . . . . . . . . . . . . . . . . . . . . . . . . . . . . . . . . . . . .
3.3 Service Layer . . . . . . . . . . . . . . . . . . . . . . . . . . . . . . . . . . . . . . . . . . . . .
3.4 User Interface Layer . . . . . . . . . . . . . . . . . . . . . . . . . . . . . . . . . . . . . . . .
4 System Design……………………………………..
4.1 Data Store . . . . . . . . . . . . . . . . . . . . . . . . . . . . . . . . . . . . . . . . . . . . . . .
4.2 Service Interface. . . . . . . . . . . . . . . . . . . . . . . . . . . . . . . . . . . . . . . . . . .
4.3 User Application. . . . . . . . . . . . . . . . . . . . . . . . . . . . . . . . . . . . . . . . . . .
4.4 Survey Data Retrieval . . . . . . . . . . . . . . . . . . . . . . . . . . . . . . . . . . . . . .
4.5 Solution Layout . . . . . . . . . . . . . . . . . . . . . . . . . . . . . . . . . . . . . . . . . . .
5 Results…………………………………………..
5.1 Quantitative Data Analysis . . . . . . . . . . . . . . . . . . . . . . . . . . . . . . . . . .
5.2 Qualitative Data Analysis . . . . . . . . . . . . . . . . . . . . . . . . . . . . . . . . . . .
6 Conclusions ……………………………………….
6.1 Achievements . . . . . . . . . . . . . . . . . . . . . . . . . . . . . . . . . . . . . . . . . . . . .
6.2 Future directions . . . . . . . . . . . . . . . . . . . . . . . . . . . . . . . . . . . . . . . . . .
6.2.1 Pilot Methodology. . . . . . . . . . . . . . . . . . . . . . . . . . . . . . . . . . . .
6.2.2 Communication Efficiency. . . . . . . . . . . . . . . . . . . . . . . . . . . . . .
6.2.3 Immersive models . . . . . . . . . . . . . . . . . . . . . . . . . . . . . . . . . . . .
REFERENCES……………………………………….
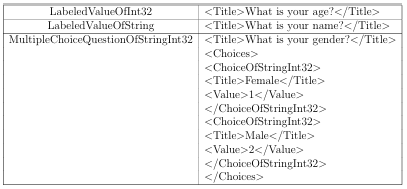
A Sample Survey Configuration File……………………….
BXMLSQL Queries ………………………………….
C Solution Files………………………………………
LIST OF TABLES
4.1 Example configuration settings. . . . . . . . . . . . . . . . . . . . . . . . . . . . . . . .
LIST OF FIGURES
1.1 A depiction of the structure of the focus groups evaluation . . . . . . . . .
3.1 Basic Architecture . . . . . . . . . . . . . . . . . . . . . . . . . . . . . . . . . . . . . . . . .
3.2 Technology and Architecture . . . . . . . . . . . . . . . . . . . . . . . . . . . . . . . . .
4.1 Sample HTML code to embed the survey engine in to a web page . . . . .
4.2 Home Screen. . . . . . . . . . . . . . . . . . . . . . . . . . . . . . . . . . . . . . . . . . . . . .
4.3 Modeling Screen. . . . . . . . . . . . . . . . . . . . . . . . . . . . . . . . . . . . . . . . . . .
4.4 Analysis Screen. . . . . . . . . . . . . . . . . . . . . . . . . . . . . . . . . . . . . . . . . . . .
4.5 Utilities Screen. . . . . . . . . . . . . . . . . . . . . . . . . . . . . . . . . . . . . . . . . . . .
5.1 Round one percentage of covered seating. . . . . . . . . . . . . . . . . . . . . . . .
5.2 Round two percentage of covered seating. . . . . . . . . . . . . . . . . . . . . . . .
5.3 Round three percentage of covered seating. . . . . . . . . . . . . . . . . . . . . . .
5.4 Round one number of seats . . . . . . . . . . . . . . . . . . . . . . . . . . . . . . . . . .
5.5 Round two number of seats . . . . . . . . . . . . . . . . . . . . . . . . . . . . . . . . . .
5.6 Round three number of seats . . . . . . . . . . . . . . . . . . . . . . . . . . . . . . . . .
5.7 Round one selected events . . . . . . . . . . . . . . . . . . . . . . . . . . . . . . . . . . .
5.8 Round two selected events . . . . . . . . . . . . . . . . . . . . . . . . . . . . . . . . . . .
5.9 Round three selected events . . . . . . . . . . . . . . . . . . . . . . . . . . . . . . . . . .
LIST OF ABBREVIATIONS
ASPX – Active Server Page
BSU – Boise State University
CSV – Comma Separated Values
GIS – Geographic Information System
HTTP – Hyper Text Transfer Protocol
HTML – Hyper Text Markup Language
IRB – Institutional Review Board
HTML5 – The current standard version of HTML
JSON – Java Script Object Notation
MEF – Microsoft Extensibility Framework
MVVM – Model View View Model
SOAP – Simple Object Access Protocol
SQL – Structured Query Language
TDC – Thesis and Dissertation Coordinator
URL – Universal Resource Locator
XAML – eXtensible Application Markup Language
XAP – XAML Application Package
XML – eXtensible Markup Language
XPath – Not an acronym. A query language for XML.
XSD – XML Schema Definition
CHAPTER 1
INTRODUCTION
1.1 Problem Overview
Cooperation and collaboration between multiple stakeholders is a key indicator of sustainable neighborhoods, cities and regions. Much of this work takes place with individuals and institutions. In this area, the topic of cooperation is of special interest because it forms the foundations of economic, social, and cultural decisions within cities or larger communities. Several theories exist regarding how individuals decision making process are inuenced by their individual circumstances and communities [8]. Beyond traditional inuences, some studies have shown that agent-based modeling can perform a role in local and regional decision making [10]. Where study participants have access to GIS information, it has been shown to be an informative element of the model [5] and
especially useful in public works planning collaborations [9].
Research of cooperative behavior within a population of autonomous individuals has led to studies of multi-agent systems and the evolution of cooperation [7]. These studies have focused on modeling human behavior. The proposed study requires participants to have the ability to make decisions and inuence outcomes. Social scientists within Boise State University have hypothesized that beyond the self-interest and reciprocity models, human participants may also demonstrate a

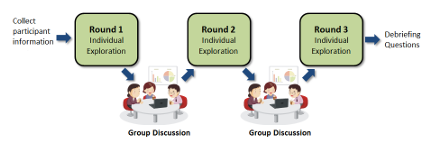
“tipping” point where individuals agree to cooperate even if bene ts are not portioned to their own. In order to evaluate this hypothesis, a means of collecting real-time data from live study participants is required. This approach is consistent with recent developments in urban planning e orts focused on increasing public participation and eliciting community input [1]. For this purpose, a hypothetical multi-purpose stadium to be built within the Boise city limits was used as the basis for our pilot. Study participants were to interact with a model of the stadiums impact on the community in terms of tra c, noise, and nancial impact. Inputs such as: number of seats, amount of parking, and the number and type of events impact the cost, noise, tra c, and projected economic impact in the model. Participants were able to see how their choices compared to others in their group. Timed and event-based interactions with the model caused data points from the model to be logged in a database for later analysis. The framework was exible enough to allow rapid recon guration of the model and demographic data collected. In our focus group, each user was allowed 5 minutes to individually explore the model space. At the end of each round, each user was required to select a set of parameters they felt represented the best available con guration for the stadium.
After each round, they participated in a group discussion to ask questions and understand the others choices. A composite model representing the average of the users choices was presented to the users. The discussion was followed by another round of exploration, and so on (see Figure 1.1). There were a total of three rounds of discussion. At the end of the discussions, each participant was asked to select their preferred model from the models presented at the end of each round. After the exploration, we conducted debrie ng surveys with each participant in separate rooms to obtain qualitative feedback on the process as well as the software framework.
1.2 Experimental Setup
To gain a better understanding about decision making when it comes to large infrastructure projects, we implemented a software framework to collect the quantitative data and provide real-time visualization. Data gathering was organized into a series of techniques with varying levels of participation in the study:
1. An initial survey with questions pertaining to demographics, participation in local economic development, and some general background questions.
2. After the facilitator presented instructions, individual participants selected from constrained parameterized choices about the proposed multipurpose stadium.
These selections were collected in a central data store as they were made and changed. A complete history of each participants choices was stored.
3. After each round of individual interactions with the software framework, the participants were able to view the choices of other participants. Proctors were able to view the choices as they were being made and changed in real time.
4. After the completion of the exercise, the participants were asked to complete an exit interview with questions that pertain to the factors that inuenced the decisions that they made.
For the hypothetical decision making step on this facility, we provided hypothetical data that is based in as much reality as we could for:
1. Facility Inputs: stadium size, number of seats, percentage of covered versus uncovered seating, parking spaces, and the option for additional events.
2. Facility Outputs: tax model (increase in property tax per capita), tra c con gestion [reduction of MPH], and e ects of noise from the facility.
3. Facility Bene ts: hotel and restaurant receipts and overall bene t to the city in terms of community pride with having such venues and attractions.
All personal data was held condential and the focus group design, survey, and debrie ng questions were approved by the Institutional Review Board (IRB). Each participant was provided choices on the stadium size, seats, parking and events. The noise (in decibels) is presented graphically with a red cloud projecting its reach and intensity. Each participant had the opportunity to provide their property value to see the impact of the stadium choices they would make on their own wallet. This information was not recorded and only provided to help participants with their exploration and decision making on the stadium. This aspect of individual exploration of scenarios and their impact on ones decisions provides a unique insight into the potential consequences of their actions on the community as a whole.
Focus Group
We invited people that we expected would be interested in the development of the downtown stadium. Participants came from the community and represented one or more of the following: policy maker, private sector developer, and potentially concerned citizen. Participants were contacted by phone and then a follow-up email was sent with details of the study purpose, time and location. There were two sessions with four different participants in each session. Each session had representatives from development, economic development, the city of Boise and one concerned citizen . The first focus group had two women and two men. And the second focus group was comprised of three women and one man. Participants were invited to attend a focus group for one and half hours.
Software Framework
Initial demographic information was collected by the soft ware framework and consisted on quantitative as well as qualitative data. Focus group participants interacted with a web-based model of the stadiums impact on the community. Inputs such as: number of seats, amount of parking, and the number and type of events will impact the cost, noise, tra c, and projected economic impact if such a stadium was to be built. Inputs were constrained to discrete values in order to limit the potential permutations and encourage convergence on a shared solution. Participants could see how their choices compared to others. Timed and event-based interactions with the model were logged in a database. Later chapters of this document elaborate on the software framework.
CHAPTER 2
FUNCTIONAL REQUIREMENTS
Tipping Point
The objective is to nd the tipping point in a group decision making process. In a group decision the tipping point occurs at a point where the group behavior or consensus, seemingly headed toward a particular decision, changes, ever so slightly, and begins changing course. Mathematically it is not at the top or the bottom of the function but at the point of in ection. It is that point where the concave function becomes convex or the convex function becomes concave. Some claim that a tipping point has occurred on a grand scale in the discussion of global warming [4]. It is asserted that a change of attitude occurred in the general public and a growing number of people have moved from a position of skepticism about the concept of warming to a position of accepting its reality and considering those actions that could/should be taken to alleviate the anticipated problems.
The tipping point is not characterized by unanimity and perhaps not even majority. It is the point where the inevitability changes direction. Nor does the tipping point necessarily signal the inevitability of an outcome. Given the ebb and ow of public discourse, one tipping point can be followed by any number of tipping points. Only after the nal decision has been made can we identify the final tipping point. We believe the tipping point(s) can be discovered through a process of reverse engineering. Given the nal decision, and if the decision making process has been documented, it should be possible to retrace the steps backward from the decision
to the last turning point and from there to any earlier turning points. We should be able to identify those points in the discussion where the available information and group dynamics changed the direction from concave to convex , i.e. it should be possible to identify all the points of in ection . In our pilot, we able to identify the tipping point leading to final convergence for several input parameters. However the number of participants was small, so further tests on other settings would be bene cial. However the tool that we have developed has demonstrated the capability to identify tipping points.
2.1 General
The application shall collect demographic and model information (the data) from users during a facilitated discussion. The current state of the demographic and model information shall be collected in real time at periodic intervals into a database. The current information will be redistributed to allow users to visualize how their model choices compare with those of their peers.
The data shall be collected so that post-discussion analysis may be performed to possibly determine if evidence of a tipping point exists. Data shall be collected with absolute and relative time stamp information.
As needed by researchers, the model may be amended. Each facilitated discussion should be viewed as a separate data set. The system shall allow for simultaneous administration of di erent models without changing the application. Multi-media data types (such as geospatial, three-dimensional, images, audio, and video, etc.) shall be available in the system as either native types or plug-ins to the system. Each data type shall store its own relevant data for later analysis.
2.2 Distribution
The application shall be distributed as a web-browser application over standard HTTP(s) protocol. It shall run in supported web browsers using industry standard browser plug-ins as necessary to provide a compelling user experience.
2.3 Scalability
In order to evaluate the impact of virtual group participation on the outcome of a survey, participants and proctors must be able to observe the choices their peers are making in near real time. This requires that some form of the data from every client be distributed to every other client. As the number of clients grow, the amount of data that must be exchanged grows on the order of the square of the number of clients.
The communication protocol for distribution and access of this system shall be HTTP over the public internet. While this protocol allows near universal delivery and access, it disallows the ability to use a broadcast protocol typically used on private networks to minimize the exchange of client data. Likewise, it also disallows peer-to-peer distribution protocols for the same reasons.
2.4 Flexibility
The system shall be exible so as to accommodate changing model and demographic requirements, and provide an environment where different types, or evolving definitions for surveys may take place. However, as a boundary within that framework, the following specifications are mandatory:
(1) Ability to allow study participants to access the application without installing any custom software.
(2) Ability to collect participant data of the following types
(3) Multiple choice
(4) Free-form text
(5) Interactive Geospatial
(6) Three-dimensional model
(7) Complex type (model)
(8)Ability for developers to extend the data types collected to include other desired types or models without recompiling the core application, and distribute those models dynamically
(9) Ability to group and order participant data into meaningful partitions.
(10) Ability to provide limited work ow between sections.
(11) Ability to change the collected data without recompiling the application.
(12) Ability to store the collected data to a data store on a centralized or distributed data repository.
(13) Ability to have multiple simultaneous con gurations hosted on a single server.
(14) Ability to provide limited interactive analysis of a given con guration to participants.
2.5 Data Collection and Future Analysis
The data store selected for the system should be exible enough to handle many different survey types without modi cation. In order to maximize performance and scalability, data should be stored simply, without the overhead of building, maintaining, and enforcing foreign key relationships. Each survey result should be treated as an atomic unit that could be distributed at the time of collection, or during analysis. While detailed analysis of the data will not be a focus of this project, the method of storing the data as well as the storage format selected should lend itself to massively parallel analysis.
CHAPTER 3
TECHNICAL SPECIFICATION
3.1 General
It is desirable that clients be able to access the system without the installation of custom software. However, some of the advanced capabilities of this survey engine will require that a capable plug-in be used to extend the native capabilities of web browsers beyond that currently available in HTML5 capable browsers using o-the shelf components. Therefore, web clients shall be required to support a capable browser plug-in such as Flash, Java, or Silverlight.
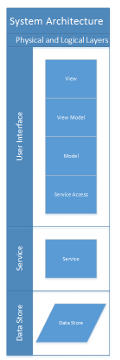
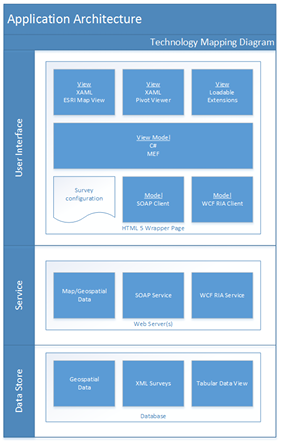
The system shall have three physical application layers: Data Store, Service, and User Interface as shown in Figures 3.1 and 3.2. The User interface shall be divided into four logical tiers: Service Access, Model, View Model, and View. Each layer is dependent upon the layer beneath it.
3.1.1 Out of Scope
User authentication shall not be addressed in the survey client application of this system. Any anonymous user shall have access to surveys in this system. User authentication may be effectively wrapped around the survey system by native mechanisms built into the HTTP protocol.

3.2 Data Store Layer
The data store is required to hold the serialized results of surveys. XML (extensible markup language) shall be used as the serialization format. The exact schema of the serialized XML is dependent upon the con guration of the survey being performed, so shall not have a required XSD. The data store layer shall also contain transformations required to provide the data to the interactive analysis portion of the user interface.
3.3 Service Layer
The service layer implementation is a web server that hosts the following:
(1) HTML/ASPX target navigation page(s) for the active survey(s)
(2) Compiled XAP (XAML execution package) application package
(3) Compiled XAP extension packages
(4) Survey con guration le(s)
(5)Web service for retrieving/sending data with the data store written
3.4 User Interface Layer
The user interface is a Microsoft Silverlight application using the .NET 4.0 framework. Upon loading, the application loads its con guration le as well as any extension packages required. When these are loaded, it begins working through the user work ow and sends survey information to the service layer on a periodic basis.

The analysis portion of the user interface layer retrieves current survey information from the service layer on a periodic basis.
Service Access
Tier This tier is tied to the signature of the services accessed by the application. Together they form an application programming interface.
Model Tier
The model tier contains the entities shared with the service layer as well as application logic pertaining to those entities. This application is considered a rich client because it makes extensive use of the client to perform processing; and as such has most of the application logic in the model of the client application.
View Model Tier
The view model tier contains objects that orchestrate models and coordinate user events with actions on the model. This layer is constructed in such a way as to decouple it from the widgets that the user sees. This application uses the view model layer to dynamically load the con guration le and extensions.
View Tier
The view tier is constructed in XAML and has very limited code. Where there is code in this layer, it has a purpose of providing the appropriate user experience.
CHAPTER 4
SYSTEM DESIGN
All design is an exercise in compromise. The design and development of this system could not hope to be any di erent. While the author believes that the resulting system meets the requirements and speci cations outlined, there will certainly be those who would have selected a different solution given the same constraints. Many of the choices were made with a bias towards expediency as well as functionality; familiar tools and technology were selected over unfamiliar tools with equivalent and equally acceptable capabilities.
4.1 Data Store
The data store for this project may be viewed as a container for of XML documents. Each document is a snapshot of the state of the user selections at a given moment in time. XML itself is not especially e cient as a transport format, but does lend itself to a variety of analysis tools after the data has been collected. Each XML Document contains (at a minimum) a survey identi er, and an instance identi er. Because these documents are completely self-contained, they need not be collocated by survey or by survey instance at the time of data collection. The lack of these constraints would allow the data collection system to scale by using inexpensive hardware and pooled or distributed hardware scaling techniques. “Big Data” techniques may easily be applied to the data once collected. For example, a Hadoop cluster could be used to analyze the distributed data.
The solution used for this project does not currently employ a distributed architecture for data collection. It uses Microsoft SQL Server as a data repository. The purpose in repurposing a database engine to emulate a le store is that SQL Server contains an excellent built-in XML parsing engine, allowing queries to be built against XML contained in the tables using extensions to standard SQL. While analysis was not the primary focus for the system at this time, the choice of a database engine over a distributed cluster provided similar results with less administration, maintenance, and more exibility for the limited datasets obtained during testing.
The database used to store the survey instance data consists of only one table, and that table contains only two columns: an auto-incrementing key, and an XML field. In order to improve the performance of the analysis characteristics of the data store, XML indices could be employed on the table. This optimization should be applied to complete data sets to avoid the speed penalty incurred when indexing occurs in a database on insertion.
4.2 Service Interface
One purpose of a service interface is to hide the complexity of the underlying system from the client applications and insulate them from changes. The service contract of this application consists of three parts: client con guration, data collection, and data distribution.
Client Con guration
Each survey is accessed via a distinct URL. The web page found at that location instructs the browser to load the Microsoft Silver light client

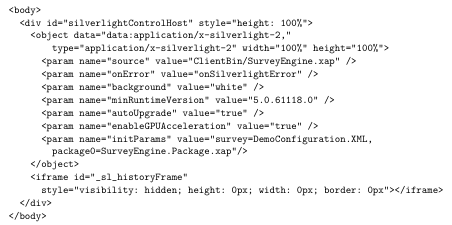
Survey
Rounds timed
Pages
Sections

4.3 User Application
The user application has two user screens, and a utility screen. When the application initializes, it navigates by default to the home screen. This is the screen used to collect demographic and model data from each user.
The user application application is written using Microsoft Silverlight [6], and requires version 5 of the Silverlight runtime to be installed. The Silverlight runtime is compatible with major browsers for Windows and Macintosh operating systems. The Silver light client communicates over HTTP with the server using web services.
A treatment of Silverlight and web services is beyond the scope of this document. The author has attempted to follow industry conventions in building this application.
Dependencies
The application was built using Microsoft Visual Studio 2010 (ser vice pack 1) and later, Visual Studio 2012. It uses C# as the primary programming language.
The client application requires that a few development SDKs be installed on the development machine:
(2) Silverlight Developer Toolkit prerequisite for the Pivot Viewer [6]
(3)Silverlight Pivot Viewer analysis functionality [6]
(4) GalaSoft MVVM Light helper types used for the Model-View-View Model patter employed by the application. [2]
(5) Microsoft Extensibility Framework (MEF) Formerly a Microsoft provided library for dynamic component instantiation. Included in Microsoft .NET 4.5.
Home Screen

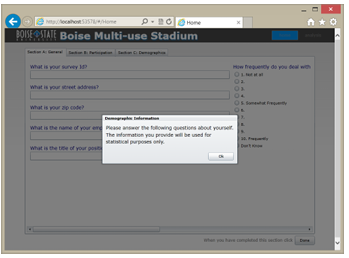
box), several pages (shown as tabs), and sections containing a few labeled values and multiple choice questions.
Modeling Screen
The modeling screen (Figure 4.3) is the primary workspace for participants in the study. It is also the most complex of the data viewers in the application. This screen contains controls allowing the user to adjust inputs for
various model inputs. The model reacts to changes in these inputs and provides both numeric and visual feedback. The relative noise level is the primary visual feedback, while various costs and bene ts are represented numerically. Changes in the model are persisted on a periodic basis to the underlying data store for limited real-time visualization in the analysis screen and more in-depth analysis at a later time.

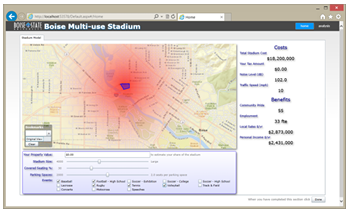
In the following screen-capture, the location of the proposed stadium is overlaid on the map in blue. The map is fully interactive, allowing pan and zoom operations as well as bookmarks. The red area around the stadium represents the relative e ect of peak noise. The user may explore the consequences of various event types, the number and type of seating, and the number of parking spaces. Property value may also be entered, but is not collected; it is used to compute a projected increase in property tax on a theoretical property. Costs and bene ts are placed together in the right panel.
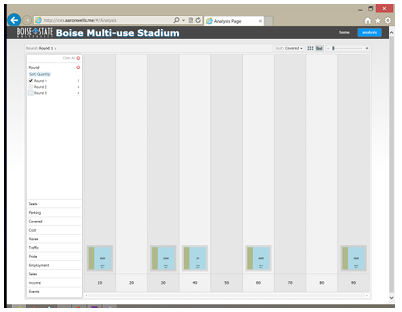
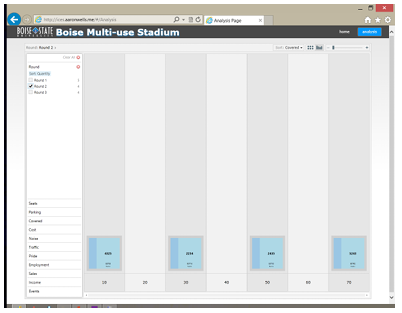
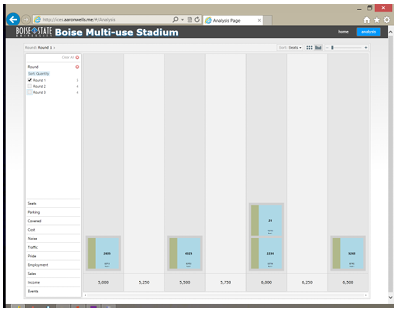
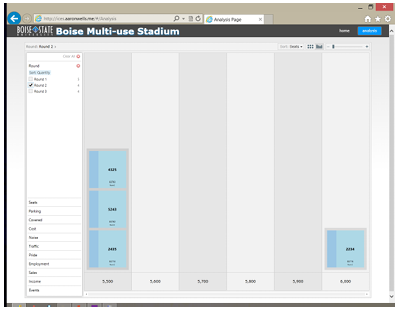
Analysis Screen
The analysis screen (Figure 4.4) uses the pivot viewer Silverlight component provided by Microsoft (Microsoft n.d.). The viewer is capable of ltering multi-dimensional data by any number of the values in each dimension and displaying a visual representation of the data in a grouped bar graph, or grid layout. Each data element may be identi ed by one or more labels. The data may be graphically

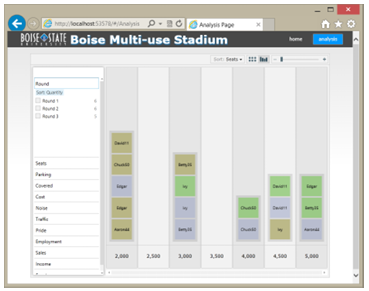
distinguished by image and/or color.
The interactive nature of the pivot viewer allows a user to add or remove lters
and see the data react. In the survey application, we extend this interactive capability by updating the dataset with the most current values available from the data store. As many users participate in a survey, an observer or other user(s) may see how changes e ect individual participants as well as the group. In our example, the dimensions provided to the pivot viewer were a combination of model inputs and computed values. Each of the three data collection rounds is assigned a di erent color. Each cell is labeled with the survey identity of the user. It should be noted that the analysis screen is neither modular, nor adaptive to radically di erent survey con gurations. It depends upon a purpose built pair of

views in the data store as well as the returned dataset. This is a limitation to the application, but was adopted to provide an example of the possibilities of real-time analysis for a large dataset. Real-time analysis of an extremely large dataset cannot be performed in the abstract due to its inherent computational intensity. Providing a con guration-based mechanism for real-time analysis of the data being collected is an open question left to future research.
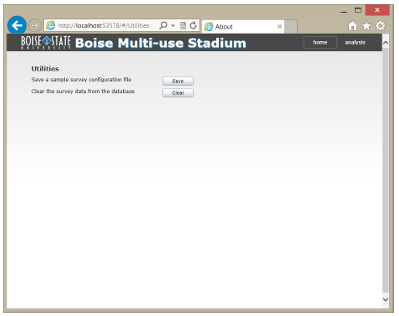
Utilities Screen
The utilities screen (Figure 4.5) does not have a visible link from the other two pages. It is accessible by changing the URL to /Utilities after the hash tag.
There are two functions provided here for developer convenience. The rst function allows for a sample con guration le to be generated from a survey that has been programmatically created. The second will remove all the data from the data store matching the survey identier provided in the con guration.
4.4 Survey Data Retrieval
As has been previously stated, Microsoft SQL Server was selected for purposes of expediency for the pilot. However, the XML data stored in the table is readily accessible by using extensions to SQL speci cally designed for this purpose. These extensions allow for XPATH statements to be executed to retrieve portions of the data contained in an XML field in the database. This is precisely the technique employed to retrieve the data for analysis. See Appendix B for the queries used to retrieve tabular data from the XML records used for the Analysis screen.
4.5 Solution Layout
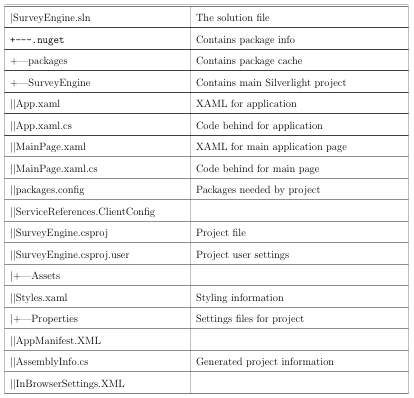
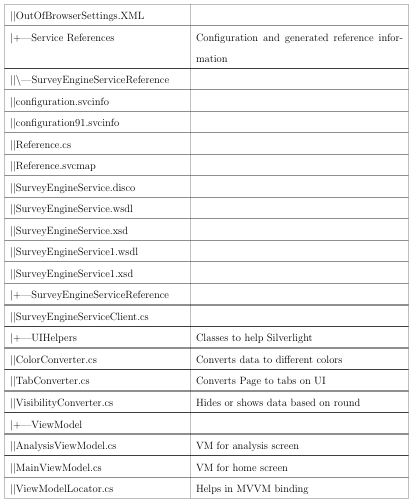
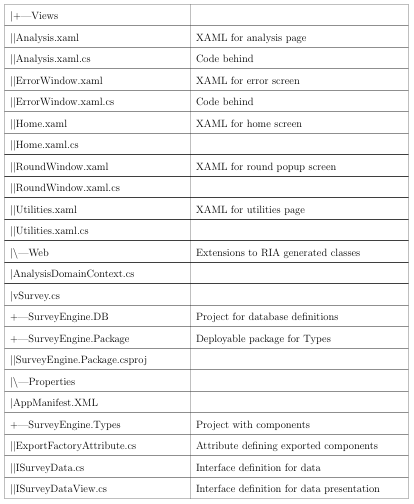
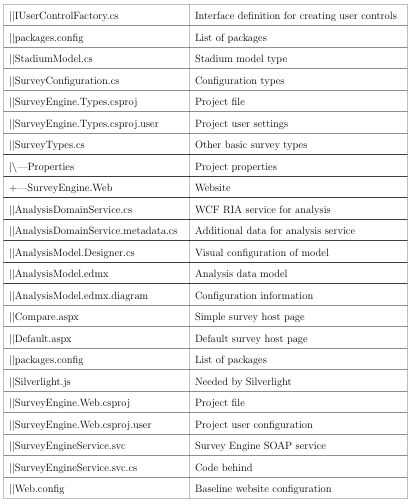
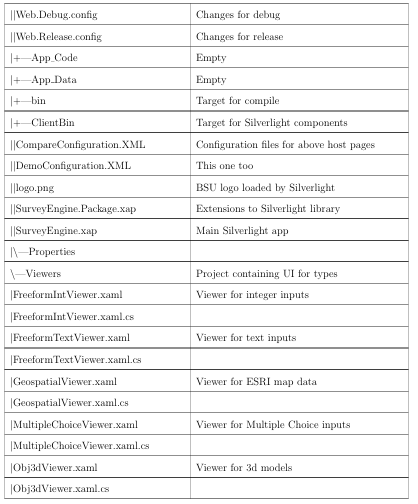
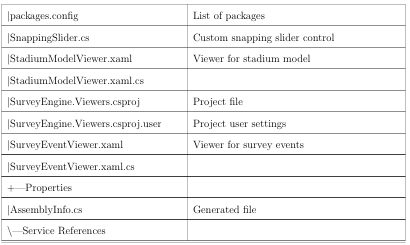
The solution contains several projects. The purposes in partitioning the solution into multiple projects are to impose a modular framework suitable for future expansion on the code and make it more maintainable. For a complete listing of files in the project and their significance, see Appendix C.
Survey Engine.Web
This is the website for the project. It ultimately hosts the components compiled by the other projects. It also provides the SOAP service (in Survey Engine Service.svc) and a WCF RIA service (in AnalysisDomainService.cs and AnalysisDomainService.metadata.cs). The user accessible website (Default.aspx) is simply an HTML wrapper for the SurveyEngine Silverlight application.
Survey Engine
The survey engine is the main Silverlight application. It contains the framework for loading the con guration le and loadable modules, but does not depend upon them. It also contains references to the WCF RIA Service and SOAP service provided by SurveyEngine.web. This assembly also contains the complete code for the analysis functionality of the application.
Survey Engine. Types
This module contains the data types used to create surveys.
Survey Engine.Viewers
This module contains the viewers associated with each of the types. These two are separated into different modules so that the viewers and types may be changed independently of each other.
Survey Engine.Package
This projectis a deploy able assembly containing the Types and Viewers module. Other than these references, there is no actual code contained in this assembly.
CHAPTER 5
RESULTS
Throughout the focus group pilot, datapoints were continuously collected from each users computer. These datapoints were relayed through the server back to the analysis screen of each participant as well as the focus group facilitators. Although primary data was captured via the survey and computer model and secondary data
rom the census was also gathered for each participant, with only 8 participants, any patterns could indicate the usefulness of this technique, but will not be conclusive.
5.1 Quantitative Data Analysis
By observing the di erences between the participants responses at the end of each round, it becomes apparent that consensus was reached for at least some items. When deciding on the percentage of covered seating for the stadium, Figures 5.1, 5.2, and 5.3 show that although the participants started with very di erent ideas on what
percentage of covered seating was best, and held on to those opinions through the second round, they were willing to come to a consensus for the third round. After round one, there was no consensus in the number of seats. However, a warm discussion ensued between the participants between rounds one and two. During
this discussion, regional comparisons and local competing facilities were compared. During the second round, a level of consensus, strongly indicative of a tipping-point


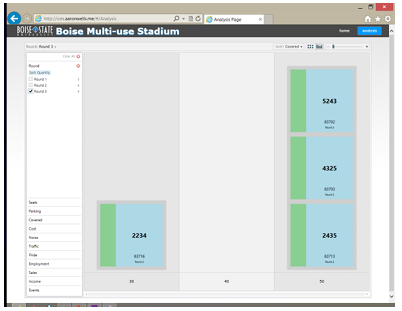


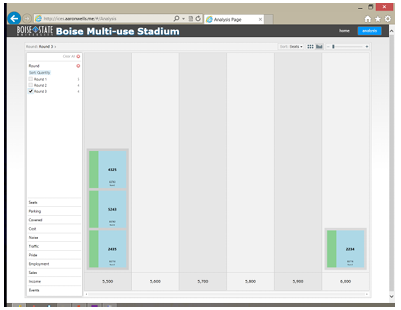
was achieved. This result held constant through the third round for each participant. Figures 5.4, 5.5, and 5.6 show this progression.
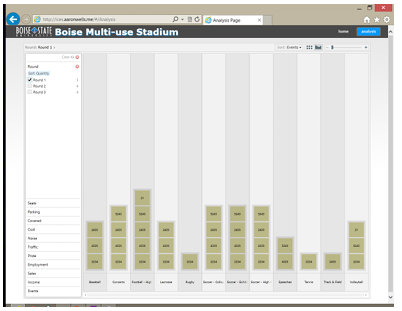
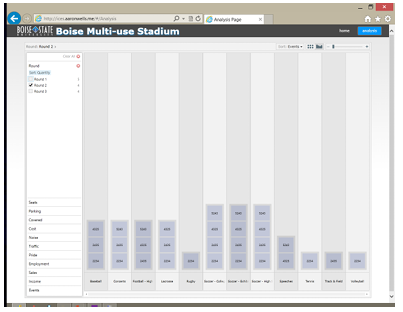
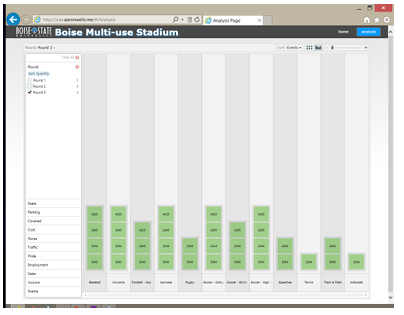
Each participant had the ability to select as many of the events as they wished. Each event had an impact on the costs and benefits of the stadium. Given this dynamic, it may be presumed that more popular event types would receive the most votes; this appears to be the case with multiple events receiving three votes and only one receiving four in the first round 5.7. In subsequent rounds, however, three 5.8 and then ve 5.9 events received unanimous support. While this does not clearly demonstrate a single tipping point, it does clearly show the underlying ability of individuals to act outside of their own personal interests for the perceived common desires.


Ultimately, the software framework appears to have worked quite well within the focus group to collect meaningful data, and allow observation of changes in the group dynamic during a deliberative process.
5.2 Qualitative Data Analysis
The qualitative data also indicated some interesting convergences. After the participants engaged in the decision making process they were debriefed by the study investigators. Specifically, each participant went to a debriefing room where they were individually asked to the following debriefing questions:
1. Whose opinion did you value the most? Why? On a scale of 1 to 10 how strongly did this person inuence your outcomes?
2. Who else could be or was inuenced by XX?
3. At what times were you tempted to change response but didnt and why?
4. At what times did you change your response and why?
5. What factors contributed to you reaching consensus or not with the rest of the group?
6. Identify two ways others inuenced your actions/outcomes (position, knowledge etc.)?
7. Do you have social ties or organizational ties to any of the members on the session? Who and what are they (social, organizational)?
8. Was the technology you used today an e ective tool to make decisions on economic development projects?
First, it was clear in each round that one person emerged as a thought leader. In the first round it was male who had expertise in professional sports and local economic development around a specific team. In the second session it was a female with expertise in downtown economic development. Participants in both groups indicated
they were inuenced because these people seemed the most knowledgeable. Five of the eight participants reported they were tempted to change their response by inuences in the discussion, but did not. The actual factors that participants reported as causing them to change their responses including becoming familiar with the software, the group discussions, and trying di erent scenarios to maximize the economic impact. Six of the eight participants report either social or professional ties with at least one other person in their focus group. This may have played a role in some people being inuenced by the two persons perceived as experts that emerged as thought leaders. Finally, the participants unanimously agreed the software helped with their decision making because it allowed them to see the outcomes of their choices. Participants indicated they could see the softwares applicability to other projects or issues. Some participants suggested it could be more sophisticated while others indicated a desire for something more intuitive. Their desired level of tool sophistication appeared to coincide with their familiarity with GIS or other modeling tools.
CHAPTER 6
CONCLUSIONS
6.1 Achievements
Any tool is subject to improvement and refinement from the moment it is rst used. The focus group study and the software developed to be used for that study is no exception. It was pleasing to the author that the software framework was so well received both by the advisory committee and the participants of the focus group.
The software framework succeeded in collecting and providing a meaningful analysis framework that provided enough of a validation of the tipping point hypothesis that additional study should be considered. The exibility of the framework allowed for changes to the survey to be quickly implemented when changes to the focus group methodology were introduced.
As a platform for future work in community planning, and possibly areas of sociology or psychology, this platform, or some future variant could provide additional insights into many different types of social dynamics. It could be especially effective if the sessions were recorded with time stamp information. Time-stamped model interactions could then be tied to triggering external stimuli.
6.2 Future directions
There are many areas where the work performed for this project could be improved. Some of these were intentionally left out of scope due to time constraints, and others were realized as a result of our experience.
6.2.1 Pilot Methodology
The software framework was designed in such a way as to collect data in real time as participants modify their choices. This advance in data collection capability represents the potential to continuously collect information from participants throughout a decision-making process rather than at arbitrary and externally imposed data
collection points such as were used for this study. If this data stream were augmented with a transcript of the discussion between participants, the data may provide additional insights into the individual and group decision making process. It is possible that individuals experience a personal tipping point distinct from that experienced by the group.
The framework was also designed to run across the public Internet. In this way, larger numbers of individuals could simultaneously (or even asynchronously) express their preferences based upon a reaction to a live or recorded discussion, if not participate in the discussion personally. The framework could also be used to inform each participant of the consensus (or lack thereof) of the population. We hypothesize that this feedback loop would also effect the decision process.
6.2.2 Communication Efficiency
The means of collecting model data in the pilot are naive. They collect a data point every 10 seconds from each user. The analysis portion of the application also polls the server for new data every 10 seconds; for a total potential latency of 20 seconds. Much work could be done to optimize the communication e ciency of the application. The following are a few suggestions:
1. Use a broadcast protocol between clients on the same network segment from super nodes to other clients.
2. Send model data to the server only when there have been changes made to the model.
3. Send a timestamp token to the server indicating the freshness of the data and only fetch data which is newer than the timestamp.
4. Compress the data.
5. Notify clients rather than using polling. The new web sockets capabilities introduced in HTML5 may provide this ability.
6.2.3 Immersive models
The pilot project used primitive feedback to users indicating noise levels around a theoretical stadium. This feedback allowed participants to interact in a more immersive way than a simple number could provide. Other immersive models employing sound, three-dimensional models, and other game like capabilities could encourage users to experiment and discover solutions not envisioned by the model creators. Future work may expand upon this theory, providing more efficient means of feed back, more interactive or immersive models, asynchronous group model interactions, and less intrusive data collection mechanisms.
REFERENCES
[1] Bugs, Geisa, Carlos Granell, Oscar Fonts, Joaquin Huerta, and Marco Painho. 2010. An assessment of Public Participation GIS and Web 2.0 technologies in urban planning practice in Canela, Brazil. Cites 172-181.
[2] Bugnion, Laurent. n.d. MVVM Light Toolkit. Accessed March 16, 2013. http://www.galasoft.ch/mvvm/.
[3] ESRI. n.d. Mapping APIs and Services for Developers. Accessed March 16, 2013. http://www.esri.com/getting-started/developers/get-started/silverlight.
[4] Gladwell, M. 2006. The tipping point: How little things can make a big difference. By Brown and Little.
[5] Kocabas, Verda, Suzana Dragivcevic, and Eugene McCann. 2012. Integration of a GIS-Bayesian Network Agent-based Model in a Planning Support System as a Framework for Policy Generation. Journal of the Urban and Regional Information Systems Association 35-52.
[6] Microsoft. n.d. Silverlight PivotViewer. Accessed March 16, 2013. http:// www. microsoft .com/ silverlight / pivotviewer/.
[7] Rezaei, Golriz, and Michael Kirley. 2009. The e ects of time-varying rewards on the evolution of cooperation. Evol. Intel. 207-218.
[8] Sosis, Richard, Sharon Feldstein, and Kim Hill. 1997. Bargaining Theory and Cooperative Fishing Participation on Ifaluk Atoll. Human Nature, October 15: 163-203.
[9] Tang, Kathy X., and Nigel M. Waters. 2005. The internet, GIS and public participation in transportation planning. Progress in Planning 7-62.
[10] Zellner, Moira L., Leilah B. Lyons, Charles J. Hoch, Jennifer Weizerorick, Carl Kunda, and Daniel C. Milz. 2012. Modeling, Learning, and Planning Together: An Application of Participatory Agent-based Modeling to Environmental Planning. Journal of the Urban and Regional Information Systems Association 77-92.
APPENDIX A
SAMPLE SURVEY CONFIGURATION FILE


APPENDIX B
XML SQL QUERIES
Query for vSurvey
SELECT
ISNULL(M.Id,0) Id,
SurveyData.value((/Survey//InstanceUid)[1], UniqueIdentifier) AS
InstanceUid,
SurveyData.value((/Survey//SurveyUid)[1], UniqueIdentifier) AS SurveyUid,
SurveyData.value((/Survey//Round)[1], nvarchar(max)) AS Round,
SurveyData.value((/Survey//Closed)[1], bit) AS Closed,
SurveyData.value((/Survey//ElapsedTime)[1], int) AS ElapsedTime,
SurveyData.value((/Survey//AbsoluteTime)[1], DateTime) AS AbsoluteTime,
SurveyData.value((/Survey//Value[@Index=”1″])[1], nvarchar(max)) AS
SurveyKey,
SurveyData.value((/Survey//Value[@Index=”3″])[1], nvarchar(max)) AS
ZipCode,
SurveyData.value((/Survey//StadiumModel//Parking)[1], int) AS Parking,
SurveyData.value((/Survey//StadiumModel//Covered)[1], int) AS Covered,
SurveyData.value((/Survey//StadiumModel//Cost)[1], float) AS Cost,
SurveyData.value((/Survey//StadiumModel//Noise)[1], float) AS Noise,
SurveyData.value((/Survey//StadiumModel//Traffic)[1], float) AS Traffic,
SurveyData.value((/Survey//StadiumModel//Pride)[1], float) AS Pride,
SurveyData.value((/Survey//StadiumModel//Employment)[1], float) AS
Employment,
SurveyData.value((/Survey//StadiumModel//Sales)[1], float) AS Sales,
SurveyData.value((/Survey//StadiumModel//Income)[1], float) AS Income,
(SELECT SUBSTRING( CONVERT(NVARCHAR(max),
S.SurveyData.query(for $i in //Event return
concat(“,”,data($i/@Name)))),2,5000 ))
as Events
FROM
dbo.Survey s
JOIN (Select Min(Id) Id, Max(Id) MaxId, [Uid] from Survey Group By [Uid]) M
ON S.Id = M.MaxId–and S.Uid = M.Uid
WHERE SurveyData.value((/Survey//Value[@Index=”1″])[1], nvarchar(max)) <>
Query for vSurveyEvent
Select
ISNULL(ROW_NUMBER() OVER (ORDER BY s.Id, T2.ev.value((.)[1],int)),0)
as Id,
ISNULL(M.Id,0) AS SurveyId,
[Uid] AS InstanceUid,
T2.ev.value((.)[1],int) as EventId,
T2.ev.value((@Name)[1],nvarchar(max)) as EventName
From dbo.Survey s
join (Select Min(Id) Id, Max(Id) MaxId from Survey Group By [Uid]) M
on S.Id = M.MaxId
CROSS APPLY SurveyData.nodes(/Survey/StadiumModel/Events/Event) as T2(ev)
APPENDIXC
SOLUTION FILES